
- Gold price drifts lower as signs of easing US-China trade tensions undermine safe-haven demand.
- The USD reverses a part of the overnight slide and exerts additional pressure on the XAU/USD pair.
- Fed rate cut bets might cap the USD and help limit losses for the commodity amid geopolitical risks.
Gold price (XAU/USD) recovers slightly from the vicinity of the $3,300 mark, though it sticks to its intraday losses through the first half of the European session amid signs of progress in tariff negotiations. Furthermore, investors remain hopeful over the potential de-escalation of trade tensions between the US and China, which is seen undermining the safe-haven precious metal. Apart from this, the emergence of some US Dollar (USD) buying turns out to be another factor weighing on the commodity.
Trump’s rapidly shifting stance on trade policies has been received poorly by investors and adds to a layer of uncertainty in the market. Moreover, prospects for more aggressive policy easing by the Federal Reserve (Fed) could cap the USD and lend support to the non-yielding Gold price. Traders might also opt to wait for this week’s US macro releases – including the Fed’s preferred inflation gauge and the Nonfarm Payrolls (NFP) report – before positioning for the next leg of a directional move.
Daily Digest Market Movers: Gold price bulls remain on the sidelines as positive risk tone dents safe-haven demand
- China’s recent moves to exempt certain US goods from its retaliatory tariffs showed a willingness to de-escalate tensions between the world’s two largest economies. Moreover, US Treasury Secretary Scott Bessent said on Monday that many top US trading partners have made “very good” tariff proposals.
- Signs of trade progress support the upbeat market mood. Meanwhile, the US Dollar regains traction and drives flows away from the safe-haven Gold price.
- Investors, however, remain on the edge on the back of mixed signals regarding the state of negotiations between the US and China. In fact, US President Donald Trump said last week that trade talks with China were underway, though China has denied that any tariff negotiations were taking place.
- Meanwhile, traders expect the Federal Reserve to resume its rate-cutting cycle in June. Moreover, the current market pricing indicates the possibility of at least three rate cuts by the end of this year. Lower borrowing costs could help the non-yielding yellow metal to maintain a floor in the near term.
- Russian President Vladimir Putin declared a 72-hour unilateral ceasefire in the Ukraine conflict from May 8, though Ukraine’s President Volodymyr Zelensky dismissed the three-day truce. Moreover, North Korea’s involvement in the Russia-Ukraine war keeps the geopolitical risk premium in play.
- Traders now look forward to the release of the US JOLTS Job Openings data for some impetus later this Tuesday. Apart from this, US Personal Consumption Expenditures on Wednesday, and the Nonfarm Payrolls (NFP) report on Friday could provide a fresh insight into the Fed’s policy outlook.
Gold price technical setup warrants caution before positioning for an extension of the recent pullback from all-time peak
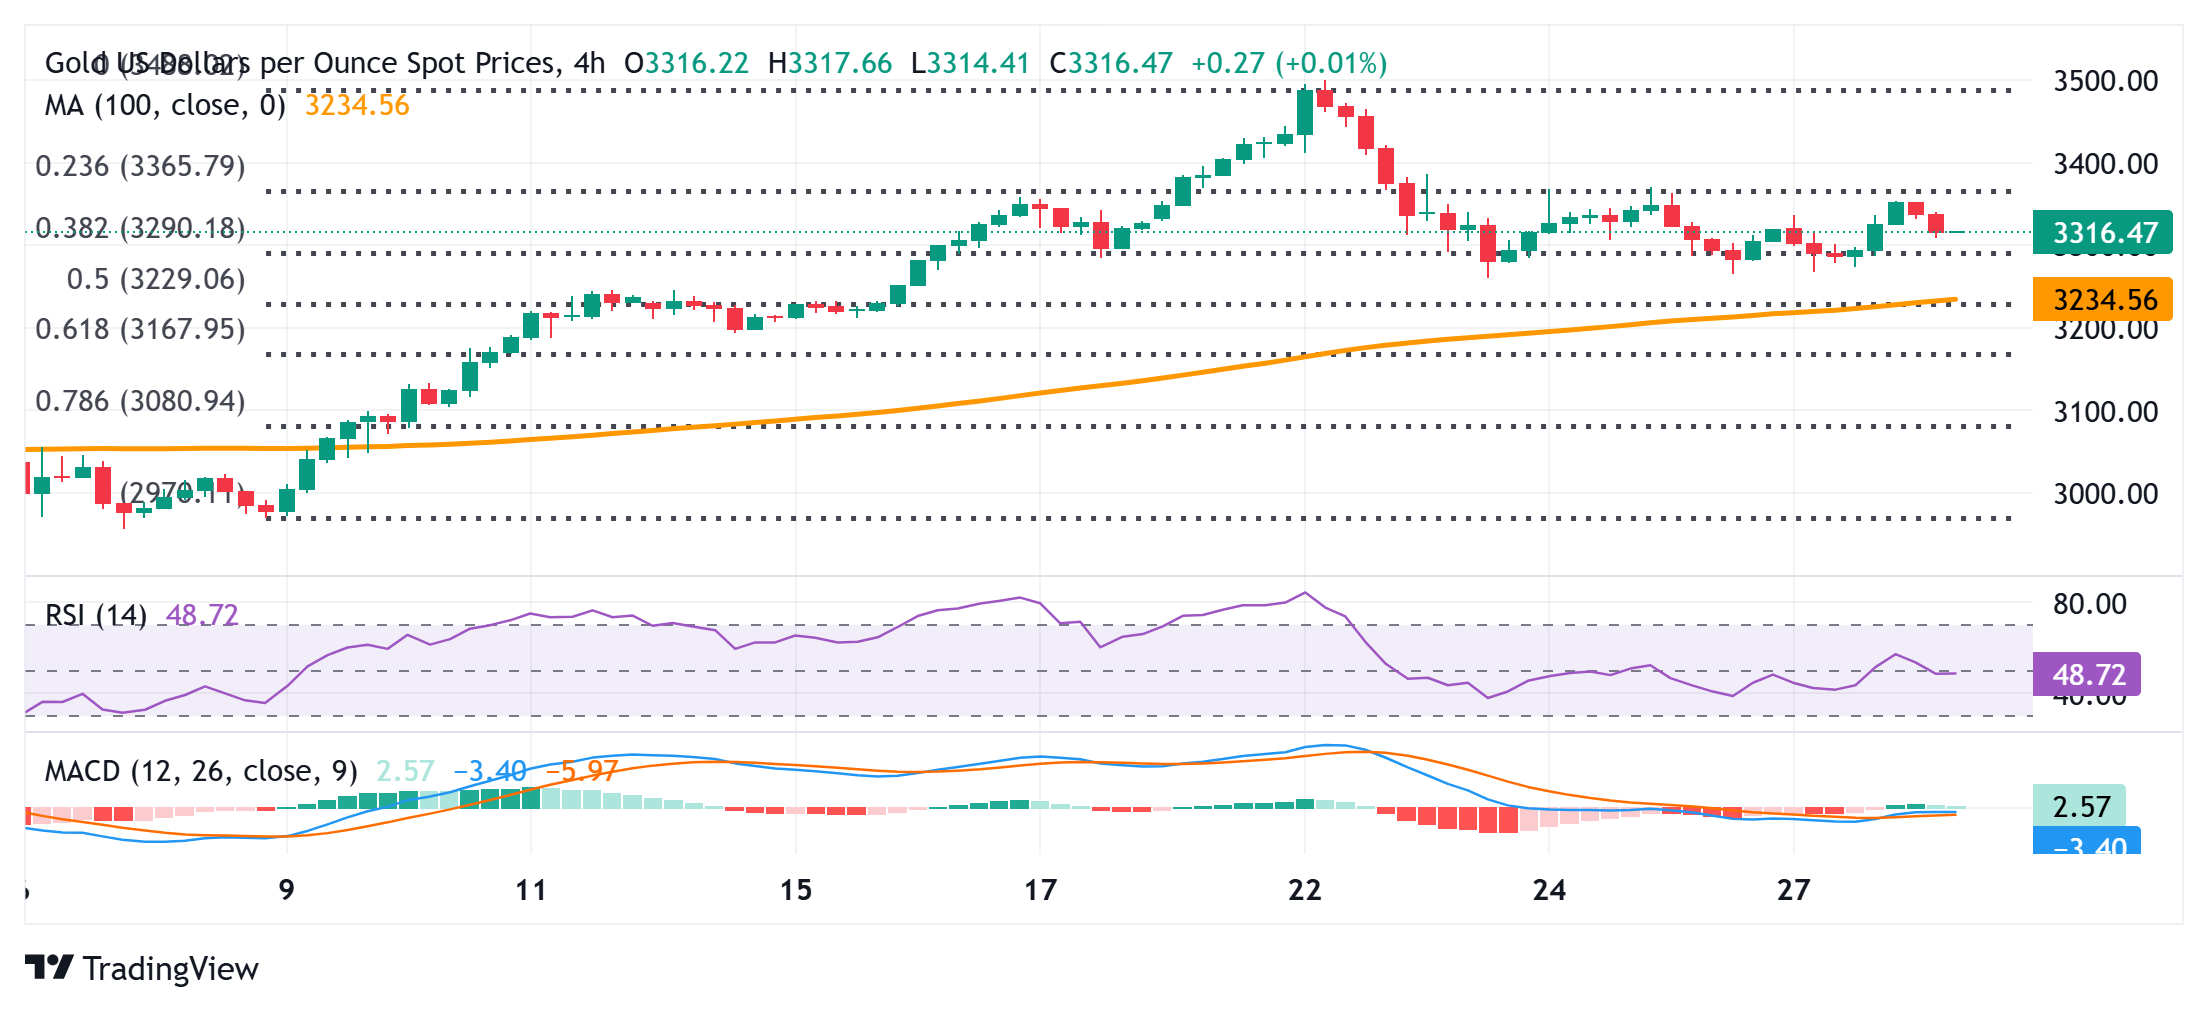
Weakness below the $3,300-3,290 area, representing the 38.2% Fibonacci retracement level of the latest leg up from the vicinity of mid-$2,900s or the monthly swing low, might continue to find decent support near the $3,265-3,260 horizontal zone. A convincing break below the latter will be seen as a fresh trigger for bearish traders and set the stage for an extension of the recent pullback from the all-time peak touched last week. The subsequent downfall could drag the Gold price to the 50% retracement level, around the $3,225 region, en route to the $3,200 mark.
On the flip side, the $3,348-3,353 region now seems to have emerged as an immediate hurdle. This is closely followed by the $3,366-3,368 supply zone, which if cleared decisively should allow the Gold price to reclaim the $3,400 mark. The momentum could extend further toward the $3,425-3,427 intermediate hurdle before bulls make a fresh attempt to conquer the $3,500 psychological mark.
Fed FAQs
Monetary policy in the US is shaped by the Federal Reserve (Fed). The Fed has two mandates: to achieve price stability and foster full employment. Its primary tool to achieve these goals is by adjusting interest rates.
When prices are rising too quickly and inflation is above the Fed’s 2% target, it raises interest rates, increasing borrowing costs throughout the economy. This results in a stronger US Dollar (USD) as it makes the US a more attractive place for international investors to park their money.
When inflation falls below 2% or the Unemployment Rate is too high, the Fed may lower interest rates to encourage borrowing, which weighs on the Greenback.
The Federal Reserve (Fed) holds eight policy meetings a year, where the Federal Open Market Committee (FOMC) assesses economic conditions and makes monetary policy decisions.
The FOMC is attended by twelve Fed officials – the seven members of the Board of Governors, the president of the Federal Reserve Bank of New York, and four of the remaining eleven regional Reserve Bank presidents, who serve one-year terms on a rotating basis.
In extreme situations, the Federal Reserve may resort to a policy named Quantitative Easing (QE). QE is the process by which the Fed substantially increases the flow of credit in a stuck financial system.
It is a non-standard policy measure used during crises or when inflation is extremely low. It was the Fed’s weapon of choice during the Great Financial Crisis in 2008. It involves the Fed printing more Dollars and using them to buy high grade bonds from financial institutions. QE usually weakens the US Dollar.
Quantitative tightening (QT) is the reverse process of QE, whereby the Federal Reserve stops buying bonds from financial institutions and does not reinvest the principal from the bonds it holds maturing, to purchase new bonds. It is usually positive for the value of the US Dollar.