
- Gold price attracts fresh buyers on Friday and moves closer to a two-week top set on Thursday.
- US fiscal concerns, US-China trade tensions, and geopolitical risks underpin the XAU/USD pair.
- Fed rate cut bets weigh on the USD and support prospects for further gains for the commodity.
Gold price (XAU/USD) retains its intraday bullish bias through the first half of the European session on Friday and is currently placed just below a two-week high touched the previous day. Concerns about the worsening US fiscal outlook, renewed US-China trade tensions, and persistent geopolitical risks turn out to be key factors underpinning the safe-haven precious metal.
Meanwhile, the US Dollar (USD) struggles to capitalize on Thursday’s upbeat US data-inspired gains amid bets for more rate cuts by the Federal Reserve (Fed). This lends additional support to the non-yielding Gold price and supports prospects for additional gains. Nevertheless, the XAU/USD pair remains on track to register its best weekly gain in more than a month.
Daily Digest Market Movers: Gold price bulls not ready to given up amid sustained safe-haven buying, USD selling bias
- The Republican-controlled US House of Representatives on Thursday narrowly passed President Donald Trump’s sweeping tax and spending bill. Trump’s dubbed “Big, Beautiful Bill”, which will add about $3.8 trillion to the federal government’s debt over the next decade, now heads to the Senate for approval.
- This comes on top of escalating US-China trade tensions, which have been fueling worries about the potential economic impact. Adding to this, the prospects for further policy easing by the Federal Reserve continue to undermine the US Dollar and assist the Gold price to stall the previous day’s retracement slide.
- On the economic data front, the US Department of Labor (DOL) reported on Thursday that the number of Americans filing for unemployment insurance fell to 227K last week. This pointed to a positive sign for the US labor market and the economy as a whole, which provided a modest lift to the US Dollar.
- Meanwhile, S&P Global’s flash estimate showed that the US economy saw a notable rebound in private sector activity in May and the Composite PMI rose to 52.1. Moreover, the US flash Manufacturing PMI increased to 52.3 in May – the highest in three months – and the Services PMI reached a two-month high of 52.3.
- Trump reportedly told European leaders that Russian President Vladimir Putin isn’t ready to end the war with Ukraine as he thinks he is winning. Adding to this, the killing of two Israeli diplomats in the US keeps geopolitical risks in play and should further offer support to the safe-haven precious metal.
- Traders now look forward to the release of New Home Sales data from the US, which, along with speeches by influential FOMC members will drive the USD demand. Apart from this, trade developments and the broader risk sentiment should provide some meaningful impetus to the XAU/USD pair.
Gold price seems poised to prolonging over a one-week-old uptrend from the monthly swing low
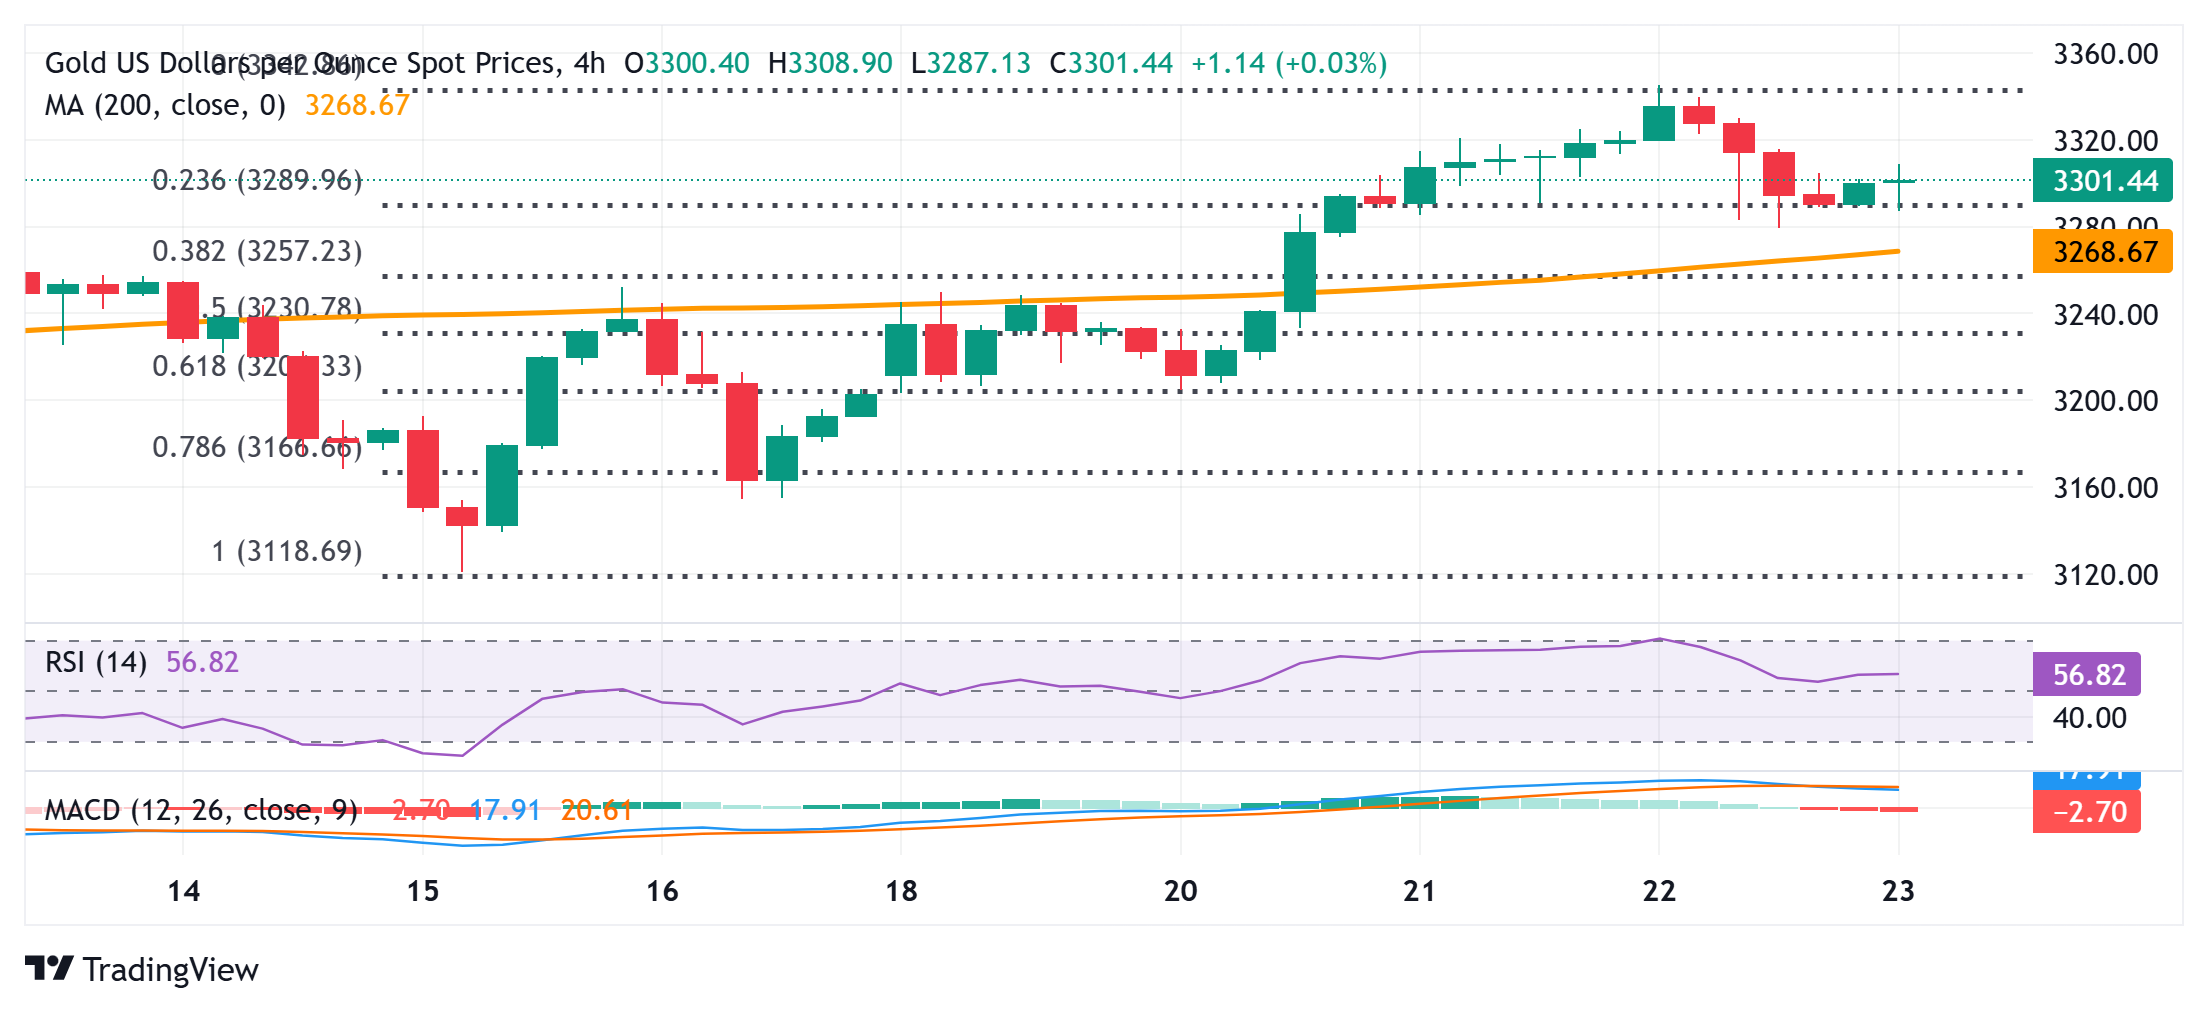
From a technical perspective, the overnight retracement slide from a two-week top shows some resilience below the 23.6% Fibonacci retracement level of the recent move up from the monthly low touched last week. Moreover, positive oscillators on hourly/daily charts favor bullish traders and support prospects for an extension of over a one-week-old uptrend. Hence, any subsequent slide could be seen as a buying opportunity and find support near the $3,260-3,258 confluence – comprising the 38.2% Fibo. retracement level and the 200-period Simple Moving Average (SMA) on the 4-hour chart. A convincing break below, however, might prompt some technical selling and pave the way for deeper losses, towards the 50% retracement level around the $3,232 region, en route to the $3,200 round figure.
On the flip side, the $3,320-3,325 zone could act as an immediate hurdle ahead of the overnight swing high, around the $3,346 area. Some follow-through buying has the potential to lift the Gold price beyond the $3,363-3,365 intermediate hurdle and allow bulls to reclaim the $3,400 round figure. A sustained strength beyond the latter will reaffirm the near-term positive outlook and set the stage for a further appreciating move.
US Dollar PRICE Today
The table below shows the percentage change of US Dollar (USD) against listed major currencies today. US Dollar was the strongest against the Canadian Dollar.
| USD | EUR | GBP | JPY | CAD | AUD | NZD | CHF | |
|---|---|---|---|---|---|---|---|---|
| USD | -0.52% | -0.51% | -0.47% | -0.29% | -0.65% | -0.74% | -0.34% | |
| EUR | 0.52% | 0.01% | 0.07% | 0.23% | -0.13% | -0.21% | 0.20% | |
| GBP | 0.51% | -0.01% | 0.06% | 0.23% | -0.11% | -0.22% | 0.19% | |
| JPY | 0.47% | -0.07% | -0.06% | 0.20% | -0.18% | -0.26% | 0.15% | |
| CAD | 0.29% | -0.23% | -0.23% | -0.20% | -0.39% | -0.44% | -0.04% | |
| AUD | 0.65% | 0.13% | 0.11% | 0.18% | 0.39% | -0.08% | 0.33% | |
| NZD | 0.74% | 0.21% | 0.22% | 0.26% | 0.44% | 0.08% | 0.40% | |
| CHF | 0.34% | -0.20% | -0.19% | -0.15% | 0.04% | -0.33% | -0.40% |
The heat map shows percentage changes of major currencies against each other. The base currency is picked from the left column, while the quote currency is picked from the top row. For example, if you pick the US Dollar from the left column and move along the horizontal line to the Japanese Yen, the percentage change displayed in the box will represent USD (base)/JPY (quote).